
Le Chatelier Principle and Concentration Time Graph
Let Chemistry Guru, Singapore's top choice for JC Chemistry tuition, guide you through the following concentration time graph.
We want to deduce what is the change at time t which causes the changes in concentration of reactants and products after time t.
Since this is a reversible reaction at equilibrium, we can use Le Chatelier Principle to deduce how the system will respond when subjected to different changes.
Check out the following video lesson to learn more about Le Chatelier Principle.
1. Change in Concentration of Reactants/Products
Let's use an increase in concentration of H2 as an example.

By LCP, position of equilibrium (POE) will shift to the right to remove excess H2.
Hence concentration of reactants will decrease, concentration of products will increase.
Let's apply these ideas to the concentration time graph.

We notice the following:
- sharp increase in concentration of H2 at time t
- gradual decrease in concentration of H2 after time t until equilibrium. Note the concentration at new equilibrium will never fall below the original equilibrium concentration as the system can only remove the change imposed partially.
- gradual decrease in concentration of N2 after time t until equilibrium
- gradual increase in concentration of NH3 after time t until equilibrium
2. Change in Pressure
Let's use an increase in total pressure as an example.

By LCP, position of equilibrium will shift to the right to favour formation of less moles of gas and lower pressure.
Hence concentration of reactants will decrease, concentration of products will increase.
This is what the concentration time graph will look like.

Notice the following:
- sharp increase in concentration of all species at time t
- gradual decrease in concentration of H2 after time t until equilibrium
- gradual decrease in concentration of N2 after time t until equilibrium
- gradual increase in concentration of NH3 after time t until equilibrium
3. Change in Temperature
Let's use an increase in temperature for example.

By LCP, position of equilibrium will shift to the left to favour endothermic reaction and absorb excess heat and lower temperature.
Hence concentration of reactants will increase, concentration of products will decrease.

Notice the following:
- no sharp change in concentration of all species at time t
- gradual increase in concentration of H2 after time t until equilibrium
- gradual increase in concentration of N2 after time t until equilibrium
- gradual decrease in concentration of NH3 after time t until equilibrium
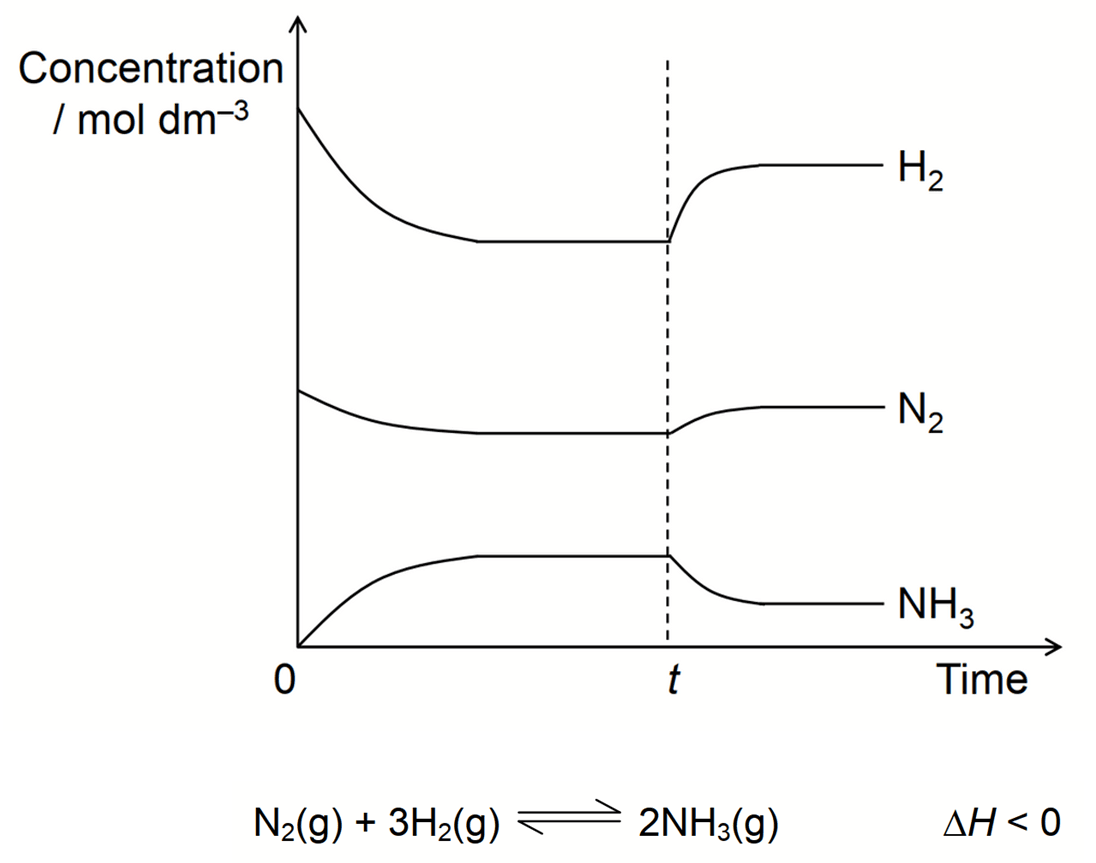
Let's come back to the question and deduce the change imposed at time t.

Notice there is no sharp change at time t for all species.
Hence this must be due to change in temperature.
After time t, concentration of reactants increase while concentration of products decrease.
Therefore position of equilibrium has shifted to the left and favour reverse reaction.

Since reverse reaction is endothermic, this means system favours the reaction that will absorb excess heat to lower temperature.
Finally since we know the system will always oppose the change imposed according to LCP, the change at time t must be an increase in temperature.
Topic: Chemical Equilibria, Physical Chemistry, A Level Chemistry, Singapore
Back to other previous Physical Chemistry Video Lessons.
Found this A Level Chemistry video useful?
This free chemistry video lesson is brought to you by Chemistry Guru, Singapore's esteemed H2 Chemistry tuition centre since 2010.
Please like this video and share it with your friends!
Join my 19,000 subscribers on my YouTube Channel for new A Level Chemistry video lessons every week.
Check out other A Level Chemistry Video Lessons here!
Need an experienced tutor to make Chemistry simpler for you?
Do consider signing up for my JC Chemistry Tuition classes at Bishan or on-demand video lessons!
