
Titration Curve for Weak Acid - Strong Base Reaction
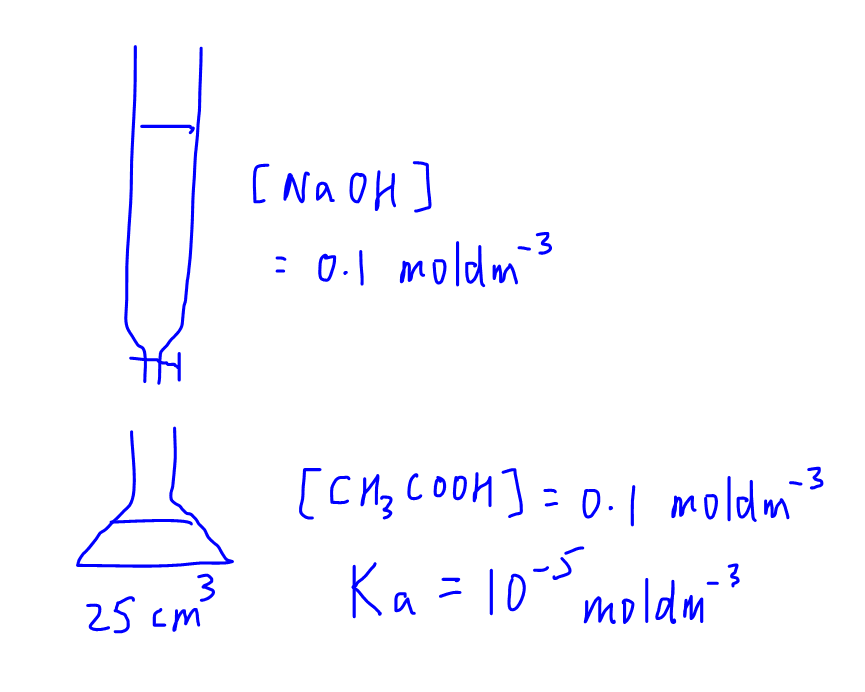
In this video we want to sketch the titration curve for a weak acid-strong base reaction.
Let Chemistry Guru, Singapore's top JC Chemistry tuition centre, guide you through the scenario:
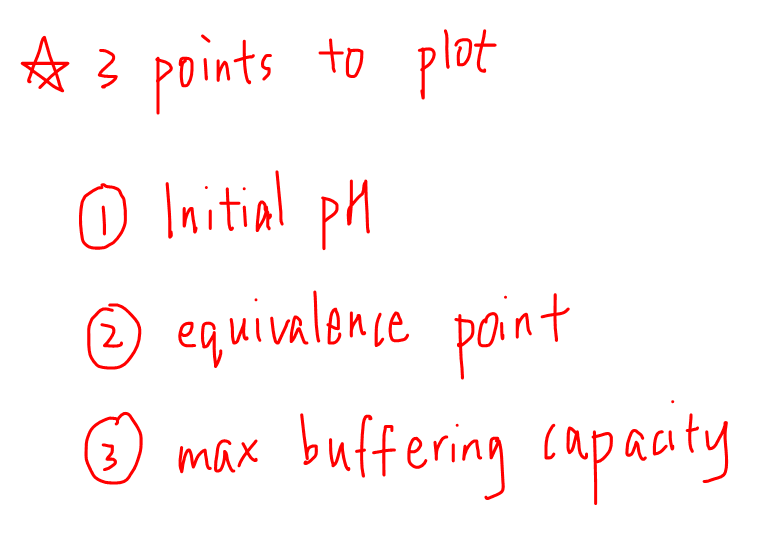
In general we have 3 points that we want to plot for titration curve.
1. Initial pH
2. Equivalence Point
3. Maximum Buffering Capacity
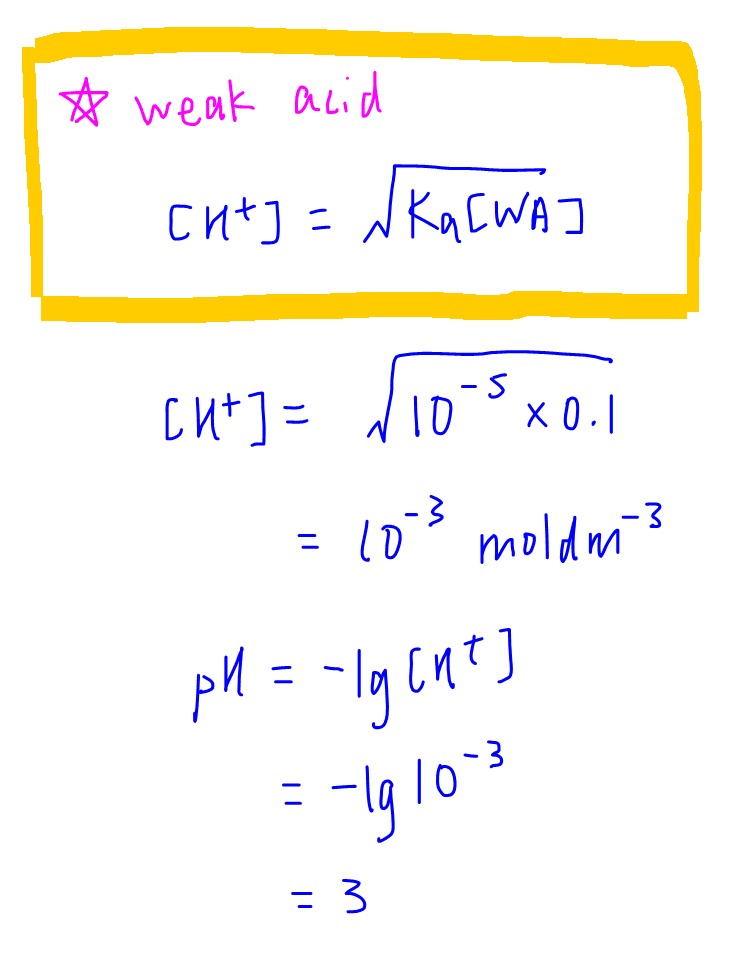
1. Initial pH
The initial pH is just the pH of the analyte before the start of reaction. Since the analyte is a weak acid, we can use the formula of to determine the pH of a weak acid directly.
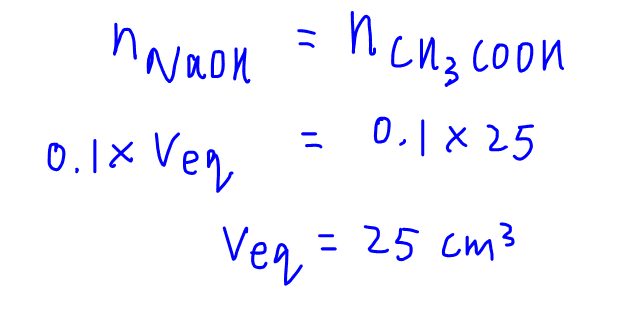
2. Equivalence Point
At equivalence point, complete neutralisation occurs as exact amounts of titrant is added to react with the analyte.
We need to determine the volume of equivalence or the volume of NaOH that is required for complete neutralisation, which is a simple mole concept calculation.
Next we need to determine the pH of equivalence point.
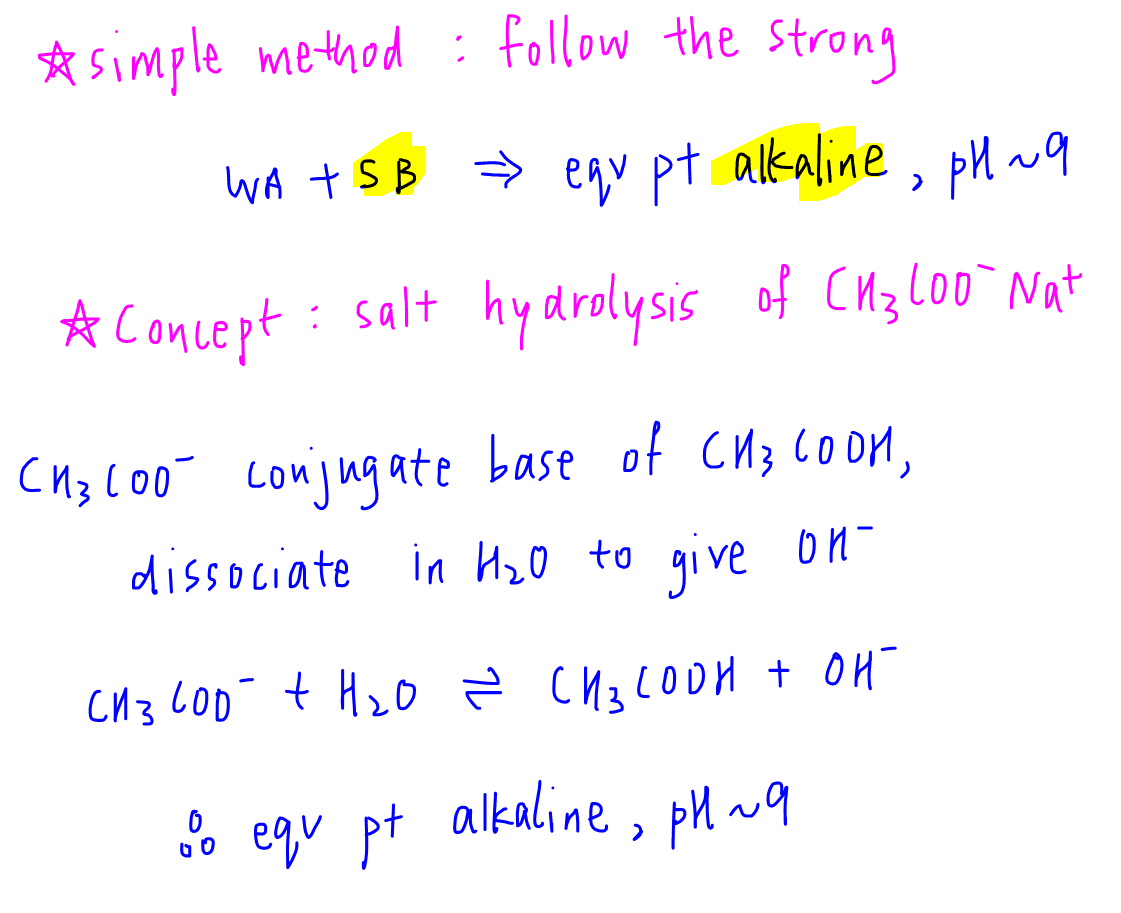
The easiest way to determine the pH is to "follow the strong".
In the case of weak acid-strong base reaction, the equivalence point will follow the strong base, so will be alkaline, pH is estimated to be around 9.
If explanation is required, then we can use concept of salt hydrolysis to deduce that CH3COO- is the conjugate base of CH3COOH, hence will dissociate in solution to give OH- and make the solution alkaline.
3. Maximum Buffering Capacity
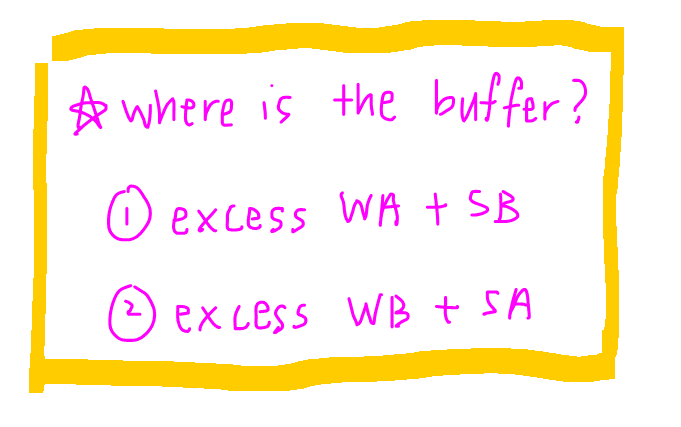
In an acid base reaction, we can deduce when a buffer is formed by focusing on the weak acid or weak base.
- For a weak acid-strong base reaction, a buffer is formed when weak acid is in excess
- For a weak base-strong acid reaction, a buffer is formed when weak base is in excess
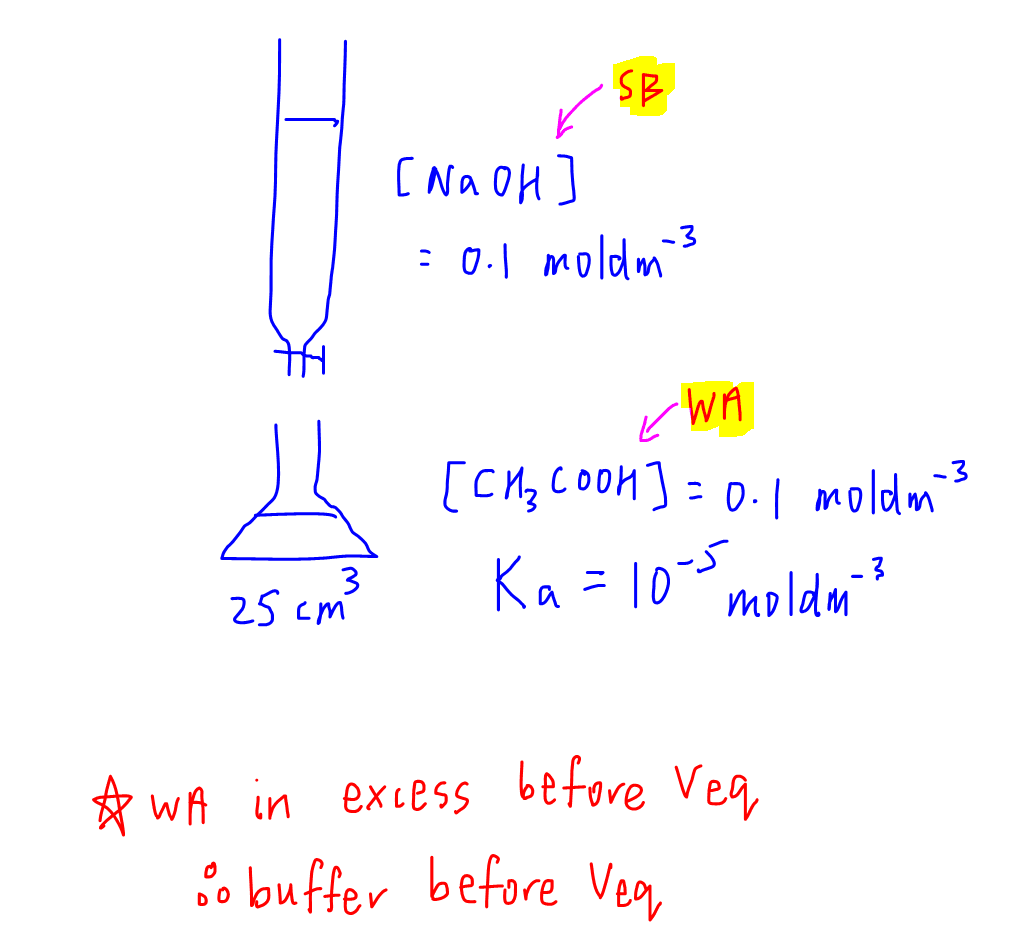
In this case since the weak acid is in the conical flask, it will be in excess before complete neutralisation.
Hence buffer will be before Veq.
Once we know the buffer region is before complete neutralisation, we can calculate the volume and pH for maximum buffering capacity.

4. Sketch Titration Curve
Finally we have all the points necessary to sketch the titration curve.
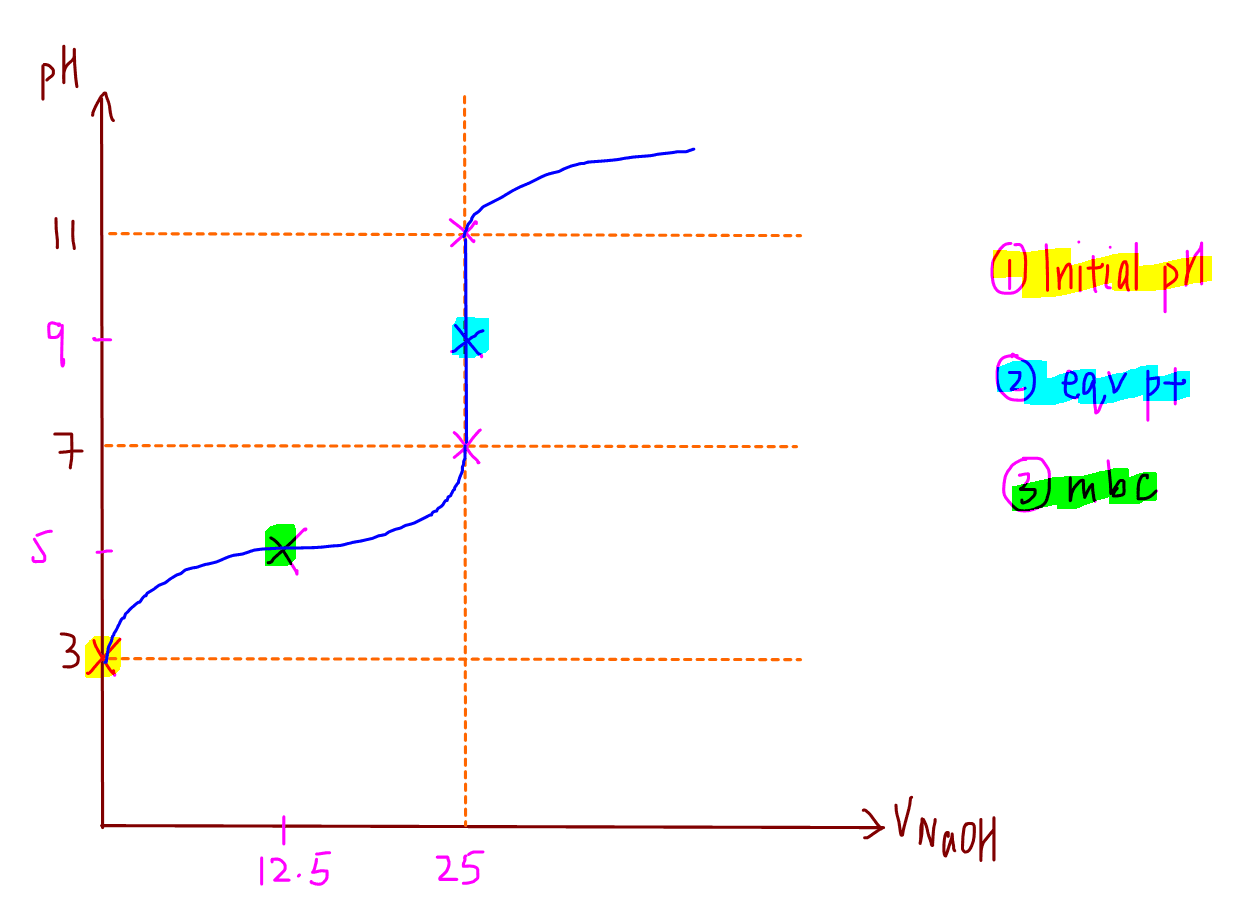
Points to note:
- gradient at maximum buffering capacity is equal to zero, hence it is a point of inflexion
- range of rapid pH change at Veq is from pH 7 to pH 11. The pH guidelines pH 3, pH7 and pH11 are useful for sketching titration curve of any monoprotic acid-base reaction
For the detailed step-by-step discussion on how to sketch this titration curve, check out this video!
Topic: Ionic Equilibria, Physical Chemistry, A Level Chemistry, Singapore
Back to other previous Physical Chemistry Video Lessons.
Found this A Level Chemistry video useful?
This free chemistry video lesson is brought to you by Chemistry Guru, Singapore's reputable A Level Chemistry tuition centre since 2010.
Please like this video and share it with your friends!
Join my 19,000 subscribers on my YouTube Channel for new A Level Chemistry video lessons every week.
Check out other A Level Chemistry Video Lessons here!
Need an experienced tutor to make Chemistry simpler for you?
Do consider signing up for my A Level H2 Chemistry Tuition classes at Bishan or online chemistry classes!
